
What a Retail Sales Report Can’t Tell You
August’s numbers were strong. Here’s the accounting behind them — and why next year’s math is different.
The terms
- MARTS
- Monthly Advance Retail Trade Survey, from the Census Bureau. Source of the monthly retail sales headline. Raw dollars, unadjusted for inflation, covering only retailers and restaurants.
- Nominal vs. real
- Nominal is dollars spent; real adjusts for price changes and tells you about quantity.
- PCE
- Personal Consumption Expenditures, BEA’s measure of everything households spend, including rent, insurance, healthcare and utilities. Roughly two and a half times the size of retail sales.
- DPI
- Disposable personal income: income after taxes.
- Personal saving rate
- Share of disposable income not spent. A flow, not a balance.
- Three agencies
- Census produces retail sales; BLS (Labor) produces CPI and the jobs report; BEA (Commerce) produces GDP, PCE and the saving rate.
What the report says
Wolf Richter’s September 16 piece reports August retail sales at $773 billion, up 1.2% from July and 6.0% year over year; excluding gas stations, up 1.1% monthly and 4.9% annually, with restaurants and bars up 5.8% and ecommerce up 10%.1
Every figure is correct. This isn’t a rebuttal — it’s the layer underneath.
Part 1: Dollars are not goods
MARTS is nominal. Headline CPI rose 3.4% over the year to August.2
Richter supplies the key correction himself: gas station sales track the gasoline price because the survey counts dollars, not gallons.1 Sales rose 21%; gasoline prices rose 27.4%.2 Americans bought roughly 5% fewer gallons than a year ago.
Groceries are murkier. Food and beverage sales rose 0.5% against 2.2% food-at-home inflation,12 implying about 1.7% less food by volume — but Richter attributes the weakness to migration toward restaurants and big-box,1 and Bank of America independently confirms food spend shifting from grocery stores to restaurants.3 Channel shift absorbs an unknown share. Gallons have no such escape hatch.
Part 2: The ledger
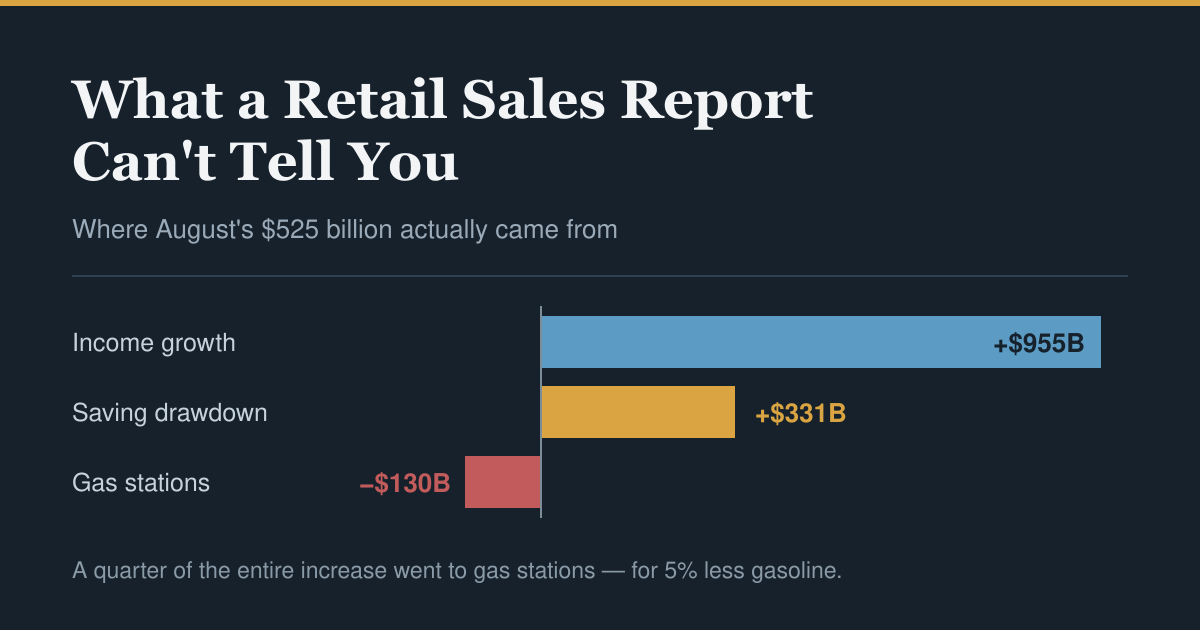
What has to be explained. At $773 billion monthly, retail annualizes to $9.28 trillion; a year ago, $8.75 trillion. The increase is about $525 billion a year — roughly $130 billion at gas stations, $396 billion everywhere else.4
Where it came from.
Saving drawdown: about $331 billion. BEA reported personal saving of $712 billion in July at a 3.0% rate, putting DPI near $23.7 trillion.5 A year earlier the rate was 4.4%.6 Had it held, saving would be roughly $1,043 billion.4
Disposable income growth: roughly $950 billion — the larger source. Nominal hourly earnings grew 3.1%,7 employment added about 0.23% and hours 0.3%,78 so labor income grew around 3.6%, below DPI’s roughly 4.2%. The gap is dividends, transfers and lower taxes: BEA notes July’s asset-income rise was led by dividends, and social benefits by Medicaid and Medicare.5
Does it close? Yes. About $1.29 trillion of new outlay capacity against a $525 billion retail increase — retail absorbed roughly 41%, matching its share of consumer spending.4 Nothing is unexplained.
A quarter of the entire nominal retail increase — $130 billion of $525 billion — went to gas stations, for about 5% less gasoline.4
The ACA transfer, decomposed
Because this is the piece people argue about, here it is precisely.
Marketplace enrollment fell from 22.3 million in 2025 to about 17.5 million in 2026.9 The average monthly payment net of tax credits rose from $113 to $178.9
| Annual | |
|---|---|
| Paid by households, 2025 (22.3M × $113 × 12) | $30.2B |
| Paid by households, 2026 (17.5M × $178 × 12) | $37.4B |
| Net change | +$7.1B out of pockets |
Split into its two parts:4
- Price effect on the 17.5M who stayed: +$13.7 billion
- Volume effect from the 4.8M who left: −$6.5 billion
And within that 4.8 million, only some genuinely freed cash. KFF’s survey found 9% of 2025 enrollees became uninsured10 — about 2.0 million people. The other 2.8 million moved to employer plans, Medicaid, a spouse’s coverage or Medicare, and are paying premiums somewhere else.
So the cash freed by 2 million people dropping health coverage is about $2.7 billion a year.4
That is:
- 0.5% of the $525 billion retail sales increase
- 2% of the additional $130 billion Americans spent on gasoline
- 0.8% of the saving drawdown
Two million people gave up health insurance, and the money that freed amounts to one-fiftieth of the extra gas bill. It is not funding the consumer economy. It’s a household-level survival move that disappears at national scale — which is exactly why the aggregate data can’t see the squeeze.
The other named transfers
Tips and overtime deductions cost about $33 billion in FY27,11 roughly 3% of the total tax cut.12 Only 3% of filers claim the tips deduction and 9–10% the overtime deduction,13 and the bottom 40% of filers receive $0–$10 from tips14 and $0–$5 from overtime.15
| Flow | Annual | Direction |
|---|---|---|
| DPI growth | ~$950B | To households |
| Saving drawdown | ~$331B | To spending |
| Gasoline price increase | ~$130B | From households |
| Tips + overtime deductions | ~$33B | To households |
| ACA net change | ~$7B | From households |
| ACA coverage-dropping | ~$2.7B | To households |
Part 3: Why health costs are rising — and it isn’t aging
Pharmacy is the fastest-moving piece. Employer-sponsored costs grew at least 7.9% in 2026, the highest in over a decade, with outpatient hospital and pharmacy accounting for 69% of the rise and pharmacy alone up 14.8%.16 Pharmacy is now about 25% of employer healthcare spend and is projected to rise 12% in both 2026 and 2027.17 GLP-1 prescriptions filled in December 2025 were nearly double December 2024,18 and Marsh actuaries estimate GLP-1 use alone accounts for a full percentage point of 2027 cost growth.19
Hospital prices are the largest cited driver. 62% of employers name hospital price increases as significant, 48% flag outpatient facility costs.17 The mechanism is consolidation — systems acquiring physician practices, which lets them add facility fees.20 Hospital services inflation hit 7.59% year over year in February 2026, a post-pandemic high.18
A new one: Milliman flagged AI as a cost factor for the first time, with hospitals using it to optimize billing and coding;16 Aon describes AI-assisted documentation producing higher billed charges.21
Aging is not among the drivers cited. The named causes are prices, drugs, utilization and billing intensity — not demographics.
Will it continue? Every forecaster says yes.
Aon projects 9.5% per employee in 2027, above $19,000, the fourth straight near-double-digit year.21 Marsh puts it at 8.2%, the biggest since 2003 and a fifth consecutive outsized increase.19 Individual-market insurers’ median trend estimate is 10%, with small group premiums proposed up a median 14%.22 Cumulatively, large-employer costs will have risen about 76% from 2018 to 2027 against roughly 32% general inflation.17 And employers have underestimated actual spend three years running, each miss larger than the last.20
Part 4: What the aggregate hides — and what it doesn’t
For divergence: the top 10% accounted for 49.2% of consumer spending, a record back to 1989, up from about 43% in 2020.23 That’s Q2 2025 data.
Against it: Bank of America titled its August 2026 report “The great convergence,” finding spending and wage growth largely converged across income groups, credit card utilization declining, and lower- and middle-income households holding elevated deposits.24 Their restaurant work finds the recovery led by younger and lower-income consumers, with Gen Z well ahead.3
Credit contradicts the distress narrative. Bank card 30-day delinquency fell to 2.85% in Q2 2026, the eighth straight quarterly decline from 3.04% a year earlier,25 below the 3.69% average since 1991.26 Prime card ABS at 60+ days hit 0.84%.25 The alarming 12.8% figure for 90+ day balances is a reporting artifact from stale charge-offs.27 Strain is subprime-specific.25
Wages show no boom at either end. The Atlanta Fed’s tracker follows the same individuals, which matters because when low-wage workers exit, averages rise mechanically. Bottom quartile 3.6%, top 3.9%, and at no point in 2026 has the bottom exceeded the top.28
The AI boom’s geography runs backwards. California unemployment was 5.5% in June 2026, highest in the country, with Bay Area leisure, hospitality, finance and tech employment all down since 2020 while education and healthcare grew 23.5%.29
Part 5: The inflation is energy
Core CPI is 2.4% and decelerating from 2.5%.2 The entire headline-to-core gap is food and energy. A demand impulse from tax cuts would show in core; core is moving the other way.
The Fed raised rates to 3.75%–4.00% on September 16, unanimously, its first hike since 2023.30 Its June statement attributed elevated inflation “in part reflecting supply shocks… including energy.”31 Goldman Sachs and Morgan Stanley both found the gasoline shock nearly cancelled the tax act’s household windfall.32 Deloitte puts it plainly: higher gasoline prices severely blunted the stimulative effect of the tax cuts.33
Part 6: Next year’s math, and when it breaks
Both 2026 funding sources are non-repeating.
The saving rate fell from 4.4% to 3.0%.56 Repeating that would require roughly 1.6% — below anything sustained in the modern series. And coverage-dropping is a stock adjustment: once uninsured, you can’t cancel again.
The third channel is already running and is invisible in spending data. KFF found payments rose 58% rather than the projected 114% partly because enrollees bought down to higher-deductible plans,9 with the average deductible rising 37%, from $2,759 to a record $3,786 — the steepest increase in the market’s history.9 Employee out-of-pocket rose 10.2% in 2026 to an average $5,297 even as employers absorbed about 82% of plan costs.21 That’s risk transfer. It doesn’t register as reduced consumption until someone gets sick.
Three scenarios
Scenario A — trends continue. Saving rate floors at 3.0%, contributing nothing. DPI growth decelerates toward 3.5% as the tax-withholding boost laps — BofA expects that year-over-year effect to last roughly a year34 — with payrolls averaging just 31,000 a month over the prior twelve.8 Nominal outlay growth around 3.5% against 3.4% inflation leaves real consumption growth near zero, before subtracting a 9% health increase and rising debt service. Discretionary real spending goes negative. Stress visible Q1–Q2 2027; an NBER-datable recession plausibly starting mid-2027.
Scenario B — energy normalizes. No recession. This is the biggest single swing factor. Energy is up 16.3% and gasoline 27.4%;2 a reversal to flat removes roughly a point from headline CPI and returns about $130 billion of annual cash flow to households.4 Inflation falls toward core at 2.4%, the Fed stops hiking, and real consumption grows around 1% with no dissaving required. This is roughly Deloitte’s baseline: 2.0% GDP growth in 2026 slipping to 1.8% in 2027 as consumer spending returns to a sustainable footing.33
Scenario C — the labor market cracks. Faster and worse. Payrolls are already at 31,000 a month,8 participation is down half a point since January,35 and the household survey showed employment falling by over a million from June 2025 to June 2026 against the establishment survey’s +506,000.36 If payrolls turn negative, the saving rate rises on precautionary motives — doubly contractionary. Recession could date to late 2026.
Professional baselines are more sanguine than Scenario A. RSM puts 12-month recession probability at 30%, down from 40%.37 U.S. Bank holds at 25%.38 Neither has a recession in its base case. But Goldman has twice cut its 2026 forecast for discretionary cash inflow — the money left after obligations — from 5.1% to 3.7%, with low-income households taking the biggest hit from the oil disruption.39
What to watch
- The saving rate. Stabilizing at 3.0% means the buffer story is over.
- Gasoline. The single largest swing factor in both directions.
- Payrolls. 31,000 a month is near stall speed.
- Restaurant sales. Most substitutable discretionary category; should crack first.
- Real PCE. Currently running about 2% annualized.
The honest conclusion is that the ledger closes for 2026 and doesn’t obviously close for 2027 without help from energy. An August retail sales report can’t settle that. These five series over the next two or three quarters will.
A note on method
The DPI figures in Part 2 are derived by dividing reported saving by a saving rate rounded to one decimal place, so mid-2025 DPI could plausibly be $22.4–$23.0 trillion and current DPI $23.3–$24.1 trillion. The $950 billion and $331 billion figures should be read as ranges rather than point estimates. Everything sourced to Census, BLS, BEA, KFF, JCT and the Federal Reserve is directly reported. Scenario A is the author’s arithmetic, not a forecast any institution is making; professional baselines sit closer to Scenario B.
Notes
- Wolf Richter, “Despite All Moaning & Groaning, Americans Not in the Mood to Slow Down,” Wolf Street, September 16, 2026, reporting Census MARTS data. ↩
- U.S. Bureau of Labor Statistics, Consumer Price Index, August 2026 (released September 11, 2026). ↩
- Bank of America Institute, “Restaurants: What’s cooking in consumer spending?” ↩
- Author’s calculation. Retail annualization from Census MARTS; saving counterfactual from BEA reported saving and rate; ACA decomposition from KFF enrollment and average-payment figures. ↩
- U.S. Bureau of Economic Analysis, Personal Income and Outlays, July 2026 (released August 26, 2026). ↩
- BEA, Personal Income and Outlays, July 2025. ↩
- BLS, Real Earnings, August 2026 (USDL-26-1497). ↩
- BLS, Employment Situation, August 2026 (USDL-26-1435). ↩
- KFF, “What We Know So Far About 2026 ACA Marketplace Enrollment, Premiums, and Deductibles,” May 19, 2026. Deductible figures: KFF, “The Average Marketplace Deductible Grew by About $1,000 Per Person in 2026.” Coverage via CNBC. Note on scope: the 58% figure covers Marketplace consumers broadly, while KFF’s earlier 114% projection applied only to enrollees receiving a tax credit who stayed in the same plan. ↩
- KFF survey of 1,117 adults enrolled in 2025 marketplace plans, fielded February 12–March 2, 2026; summarized in AJMC. ↩
- Joint Committee on Taxation estimate. Cato’s independent read puts tips and overtime together at about $30 billion a year: Cato at Liberty. ↩
- Adam N. Michel, “New Income Tax Deductions for Tax-Free Tips and Overtime,” Cato Institute Briefing Paper No. 197, February 10, 2026 (PDF). ↩
- Urban-Brookings Tax Policy Center, “What are the tax deductions for tips and overtime pay, and who benefits from them?” ↩
- Economic Policy Institute, “Everything you need to know about ‘no tax on tips.'” See also Center on Budget and Policy Priorities, “Overhyped Deductions for Tipped Income and Overtime Do Little for Workers.” ↩
- Budget Lab at Yale, via Peter G. Peterson Foundation. ↩
- 2026 Milliman Medical Index, via Becker’s Payer Issues. ↩
- Business Group on Health, 2027 Large Employer Health Care Strategy Survey (127 employers, 11 million covered lives). ↩
- PwC, “Medical cost trend 2027: Behind the Numbers.” ↩
- Marsh/Mercer 2027 employer health benefit cost projection. ↩
- Healthcare Dive, “Employers face ‘existential reckoning’ as health costs surge.” ↩
- Aon 2027 health cost projection (1,100+ U.S. employers, 7.9 million employees), reported in AJMC and Managed Healthcare Executive. ↩
- Peterson-KFF Health System Tracker, review of 2027 rate filings from 295 insurers across 50 states and D.C. ↩
- Moody’s Analytics (Mark Zandi) analysis of Federal Reserve data, Q2 2025. ↩
- Bank of America Institute, Consumer Checkpoint, August 2026 (“The great convergence”) and September 2026 (“Still sizzling”). ↩
- Federal Reserve Board series DRCCLACBS (via FRED) and Fitch Ratings prime card ABS data, Q2 2026. ↩
- LendingTree analysis of Federal Reserve delinquency data. ↩
- Federal Reserve Bank of New York, Liberty Street Economics, “How Distressed Are Consumers? Reconciling Diverging Credit Card Delinquency Measures,” August 2026. ↩
- Federal Reserve Bank of Atlanta, Wage Growth Tracker, June 2026; series also on FRED. ↩
- Christopher Thornberg, Beacon Economics, San José State University Economic Summit, June 2026, via Western Alliance Bank. ↩
- FOMC statement and CNBC coverage, September 16, 2026. ↩
- FOMC statement, June 17, 2026. ↩
- Goldman Sachs and Morgan Stanley estimates via Fortune, August 2026. ↩
- Deloitte, U.S. Economic Forecast, “Oil prices and AI investment play major role in the US economic forecast for 2026–2031.” ↩
- Bank of America Institute, Consumer Checkpoint, July 2026. ↩
- BLS, Employment Situation, August 2026. ↩
- American Action Forum, “The Household Survey Story of Employment,” August 2026. ↩
- RSM US, Economic Outlook. ↩
- U.S. Bank, Monthly Economic Outlook, August 2026. ↩
- Goldman Sachs Research, “The Outlook for the US Consumer amid Rising Inflation.” ↩